Ruby on Rails
Notes from The Complete Guide to Rails Performance's Workshop

Introduction
If you are interested in Ruby and Rails performance, you have definitely read articles by Nate Berkopec from Speedshop . At Ombu Labs we are big fans of his work, his Complete Guide to Rails Performance book and Slack community.
When Nate announced a series of public workshops I didn’t hesitate and signed up as quickly as possible. Here are my notes from my experience at the workshop on October 17th.
Pareto: The 80/20 Rule
The workshop mentioned a lot of the concepts outlined in his book. The 80/20 rule is a good guiding principle for doing performance optimization.
80% of the work performed in an application will come from 20% of the code. This is a good rule to prioritize performance optimizations: “Applying optimization/attention equally to every line of code is a waste of time when only 20% of the code causes 80% of the problems”
In order to judge which parts of your application have performance problems, you should have statistical data from your production environment (for example: NewRelic or Skylight reports from the last month’s usage). This data will be useful for determining what parts of your application is likely in need of optimization.
As Nate would say: “80% of an application’s work occurs in 20% of its code.” Similarly:

Benchmarking
After the part about prioritizing the performance optimization work, there was a quick intro to the ideas of benchmarking and profiling.
One of the best things about this workshop was that it wasn’t just theory, for
every topic there was a practical part to apply what you learned. For this
section, we used wrk to benchmark our applications.
You can quickly install wrk with Homebrew: brew install wrk
Then you can run a benchmark for one of your pages:
$ wrk -c 100 -t 100 -d 10 --latency https://www.ombushop.com
 Running 10s test @ https://www.ombushop.com
   100 threads and 100 connections
   Thread Stats   Avg      Stdev     Max   +/- Stdev
     Latency    49.29ms  124.31ms   1.94s    98.12%
     Req/Sec    27.17      9.27    50.00     73.99%
   Latency Distribution
      50%   32.03ms
      75%   36.93ms
      90%   44.21ms
      99%  711.25ms
   8429 requests in 10.10s, 52.80MB read
   Socket errors: connect 0, read 0, write 0, timeout 84
   Non-2xx or 3xx responses: 8328
 Requests/sec:    834.45
 Transfer/sec:      5.23MB
For testing purposes I used one of our products (Ombu Shop ) and its production environment. I don’t recommend that you do that: It could cause problems in your production environment and network latency could be high at the moment of your test (which would report something inaccurate just because your Internet connection had a hiccup)
I would suggest using your local environment and making sure to run it using
RAILS_ENV=production.
This quick benchmark gives you a metric that could work as a guiding light: requests per second. Also, you can see some information about the latency distribution. In this case: 50% of requests returned in less than 32.03ms; 75% of requests returned in less than 36.93; and 99% of the requests returned in less than 711.25ms.
Considering benchmarks don’t usually follow a normal distribution you should always look at the Max and +/- Stdev values.
Nate’s advice is to use production-like data. If you have little data in your database, you might end up with great results that are just not realistic. You should import a realistic data dump before running your benchmark.
Little’s Law: How many servers do I need?
In this section there was some very interesting data about products that were running Rails at some point in time: Twitter ; Shopify ; and Envato .
We saw some historical data about their average load and the amount of application servers that they were using at the time and how well they did in terms of amount of servers for their average load. There was something clearly wrong with the way Twitter was calculating the amount of application instances that they needed.
You can calculate the ideal amount of servers using this formula:
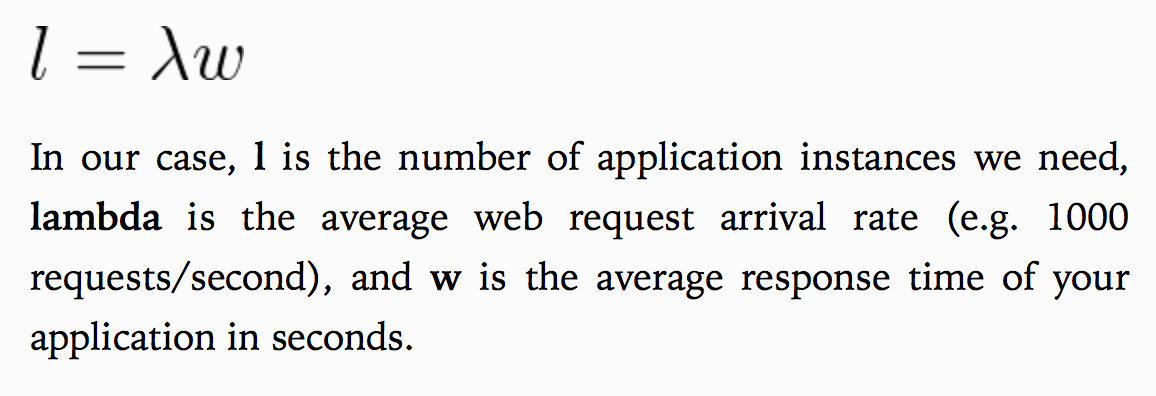
So, for Ombu Shop, we see an average response time of 319ms and an average arrival rate of 30 requests per second. That means that we need at least 10 application instances on average. To be on the safe side, we should probably have at least 40 application instances to support peak load.
Lesson learned
The amount of servers that you currently have divided by the amount of servers estimated by Little’s Law should be between 10% and 25%.
This makes sense because load is variable and you are using average metrics to calculate the ideal amount of servers.
Microbenchmarks
This section was a good refresher about different benchmarking tools in Ruby.
benchmark is
a good starting point and present in the standard library, but
if you want to take it one step further, you can use benchmark-ips which
provides metrics about iterations per second. An extension of that
gem is benchmark-ipsa which shows
information about the memory allocations of the code you are benchmarking.
One word of caution is to not let microbenchmarks drive every decision you make: Sometimes you feel the urge to search and replace Ruby idioms in order to apply a blanket solution. You must be careful with that, sometimes the context of a request is different than that of another request. So sometimes a Ruby idiom is faster within one context but not another one.
Profiling
After the lunch break, we heard a good explanation about the different types of profiling: statistical vs. tracing.
One of the pros of statistical profiling is that it has low overhead. One of the cons is that it provides low precision. Some examples of statistical profilers are NewRelic and Skylight . As much as I love Skylight’s simplicity and user interface, NewRelic provides way more data for you to analyze your app.
Tracing profilers have high overhead, but their precision is perfect. An example
of such a profiler is ruby-prof .
One word of caution is to take into account that profiling isn’t free. It will slow down your application a little bit. It is important to only use one profiler at a time.
Memory
After profiling our applications and finding slow endpoints, we learned about memory allocation and garbage collection in Ruby. We played around with ObjectSpace which is a good way to see how many objects are in memory at any point in time.
You can do this in your Rails application like this:
$ rails console
require 'objspace'
=> true
pp ObjectSpace.count_objects
{:TOTAL=>309773,
 :FREE=>5741,
 :T_OBJECT=>4979,
 :T_CLASS=>6956,
 :T_MODULE=>899,
 :T_FLOAT=>17,
 :T_STRING=>128655,
 :T_REGEXP=>2507,
 :T_ARRAY=>46208,
 :T_HASH=>2326,
 :T_STRUCT=>877,
 :T_BIGNUM=>138,
 :T_FILE=>151,
 :T_DATA=>35429,
 :T_MATCH=>971,
 :T_COMPLEX=>1,
 :T_RATIONAL=>907,
 :T_SYMBOL=>300,
 :T_NODE=>71384,
 :T_ICLASS=>1327}
 => {:TOTAL=>309773, :FREE=>5741, :T_OBJECT=>4979, :T_CLASS=>6956, :T_MODULE=>899, :T_FLOAT=>17, :T_STRING=>128655, :T_REGEXP=>2507, :T_ARRAY=>46208, :T_HASH=>2326, :T_STRUCT=>877, :T_BIGNUM=>138, :T_FILE=>151, :T_DATA=>35429, :T_MATCH=>971, :T_COMPLEX=>1, :T_RATIONAL=>907, :T_SYMBOL=>300, :T_NODE=>71384, :T_ICLASS=>1327}
 ObjectSpace.memsize_of(Array.new(10_000) { :a })
 => 80040
Some libraries that were mentioned in this section:
-
derailed_benchmarks- I didn’t get to play with this one, but we recently published a screencast about this gem: https://www.ombulabs.com/blog/rails/performance/benchmark/performance-improvements-using-derailed-benchmarks.html -
memory_profiler- I got to see some interesting information provided by this gem usingrack-mini-profiler. If you want to use this gem withoutrack-mini-profileryou can easily do it like this:
require 'memory_profiler'
report = MemoryProfiler.report do
  call_to_memory_hog
end

report.pretty_print
oink- This is a pretty interesting gem that analyzes your logs to find the endpoints that use the most amount of memory. I haven’t used it yet, but it is definitely worth a try if you are having problems with memory hogs. ;)
Rack Mini Profiler
The rack-mini-profiler gem should be in everybody’s tool belt. It gracefully
integrates with other Ruby gems like these:
gem 'rack-mini-profiler'
gem 'flamegraph'
gem 'memory_profiler'
gem 'stackprof' # ruby 2.1+ only gem 'memory_profiler'
Once you have installed it, you can run this command to setup its configuration:
rails g rack_profiler:install
After you restart your application, you will be able to see a new section in the upper left corner of every page:
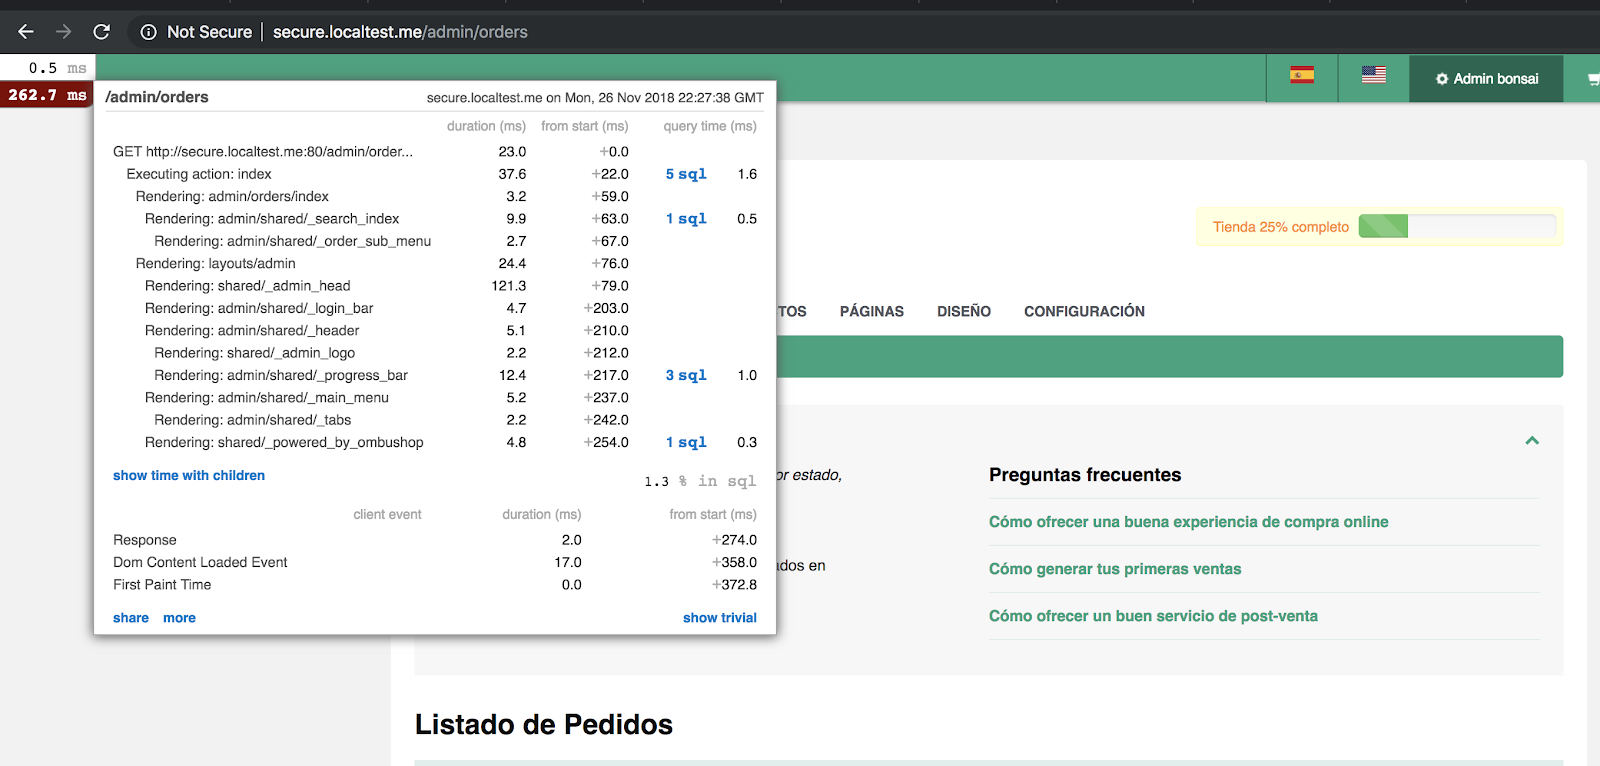
You can start clicking around to find more information about the execution of
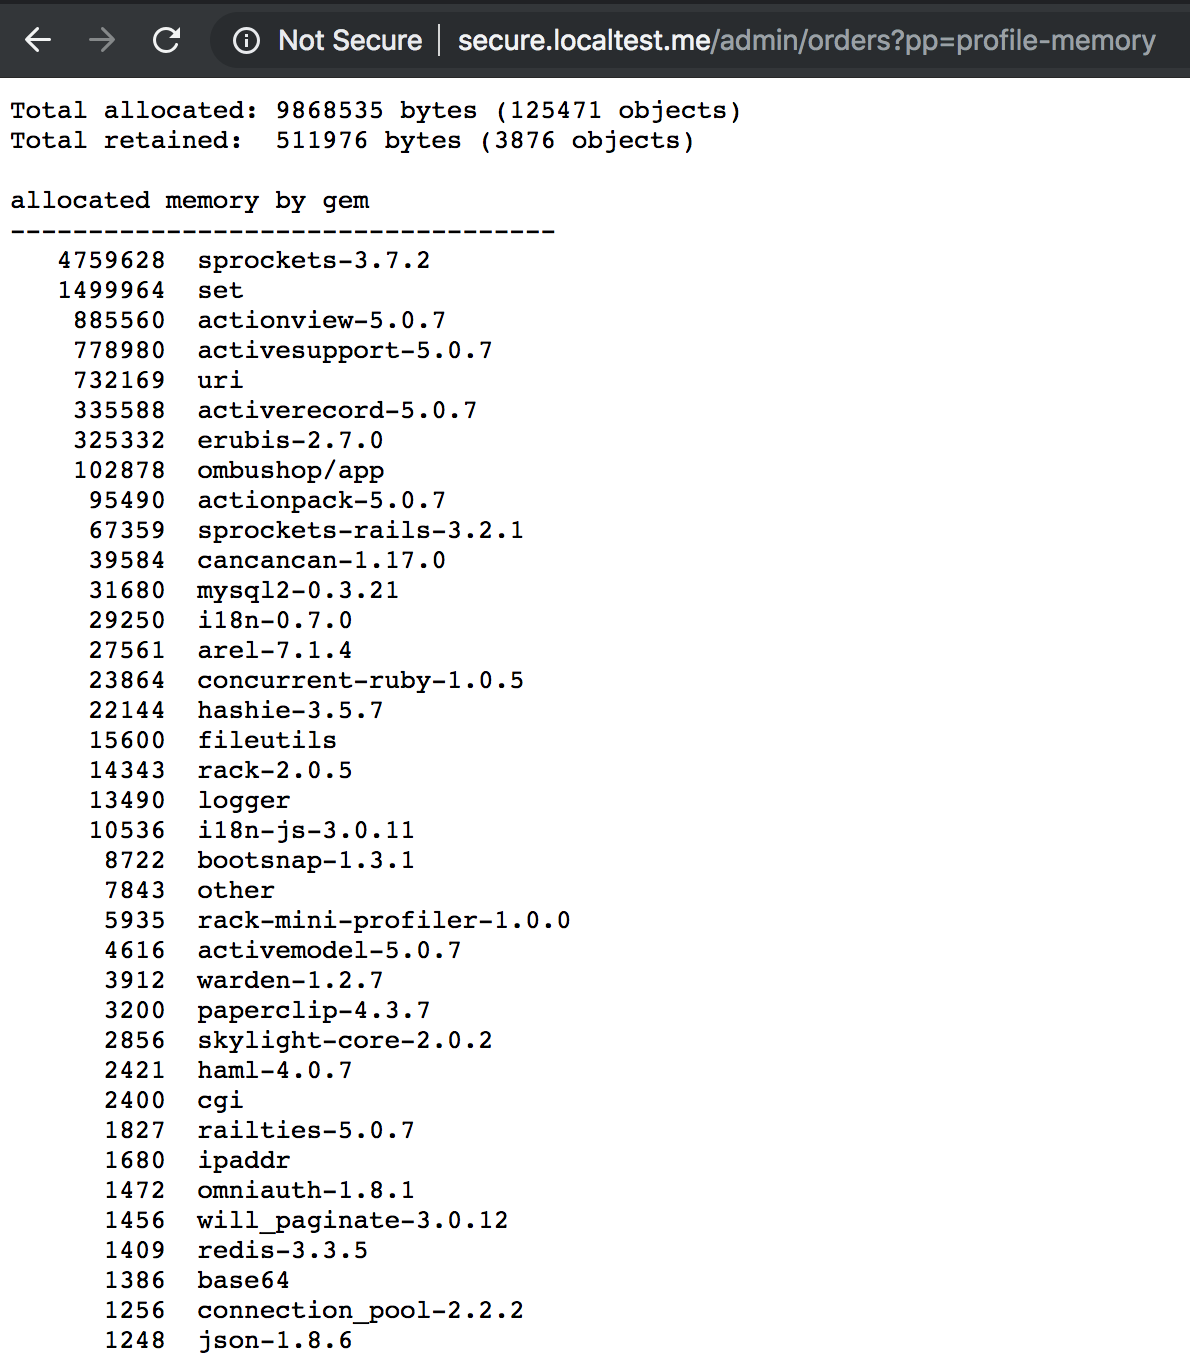
the request. If you add ?pp=profile-memory to any request, it will show you
the allocations grouped by gem. This feature depends on the memory_profiler gem.
If you want to see a CPU flame graph (What is a flame graph? ),
you can add ?pp=flamegraph to find the hottest code paths.
Adding ?pp=flamegraph to the path will output something like this:
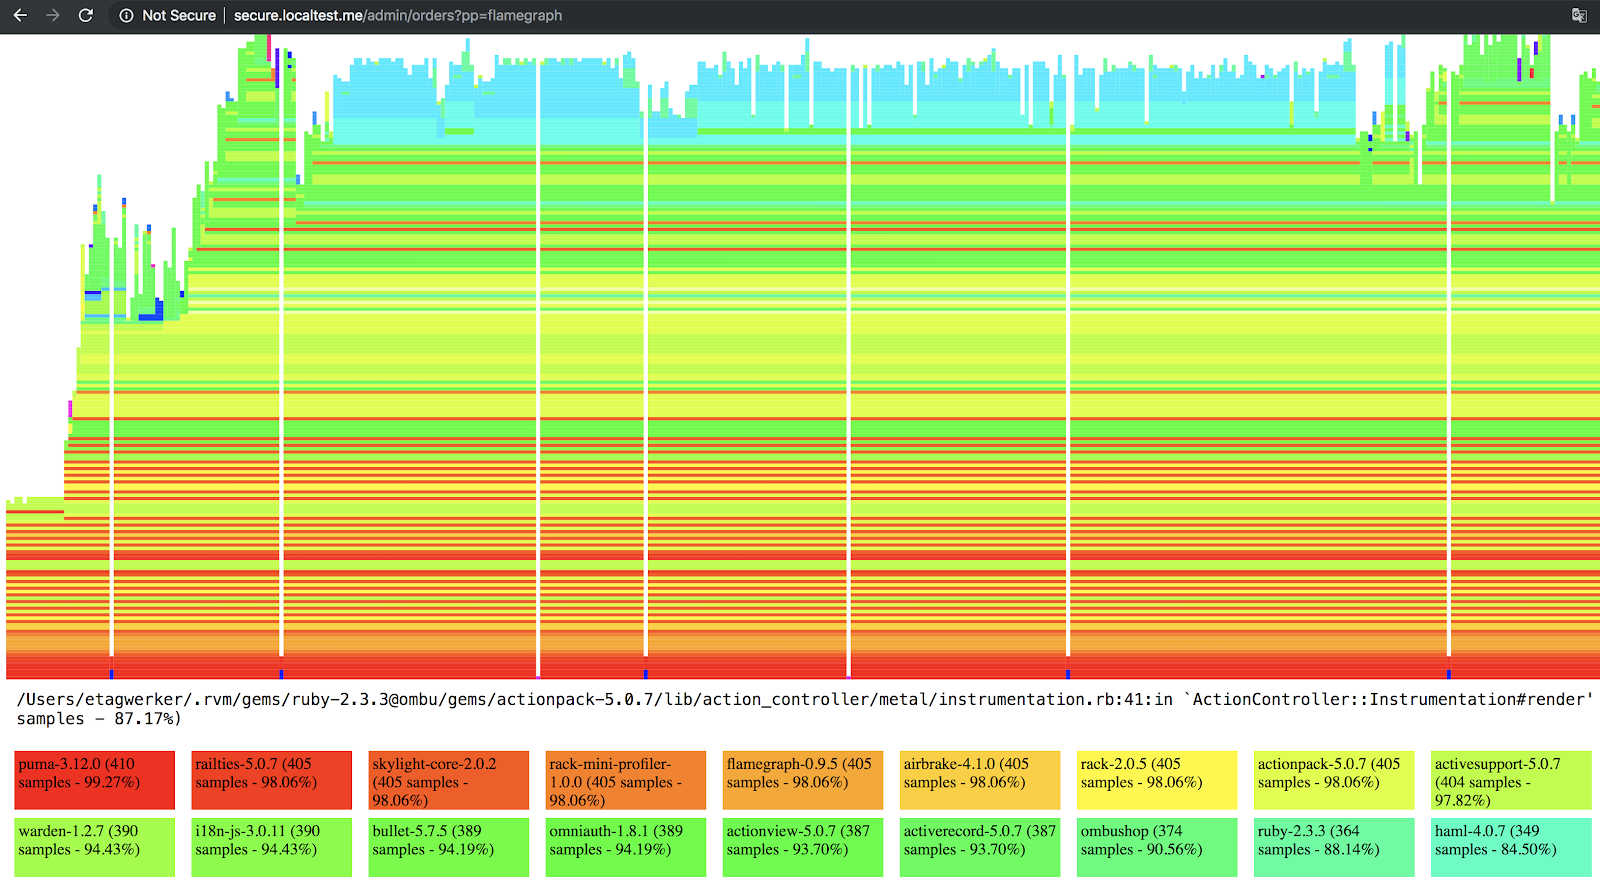
You can poke around to find the code paths that are most processor-intensive. From my experience, it can get complicated to find your own application code within that huge graph. You will need to zoom in to find some poorly performant application code.
If you have a hard time interpreting the data in the flame graph, try reading Sam Saffron’s approach to dealing with information overload .
I could probably write a lot more about this super useful gem, but maybe that
deserves a new article. If you want to explore further, you can add ?pp=help to
any request and see some documentation.
One thing to keep in mind is to make sure to use production-like data to profile your application. You can get some unrealistic results if you don’t use enough data. Also, run the profile multiple times to make sure that you see many samples, not just one or two. There may be some outliers if you only run it twice.
I enjoyed the exercise of profiling a slow controller action and trying to speed it up.
Chrome Dev Tools
After profiling a slow controller, Nate showed us a few sections in the Chrome Dev Tools that are quite useful for finding problems with slow web pages.
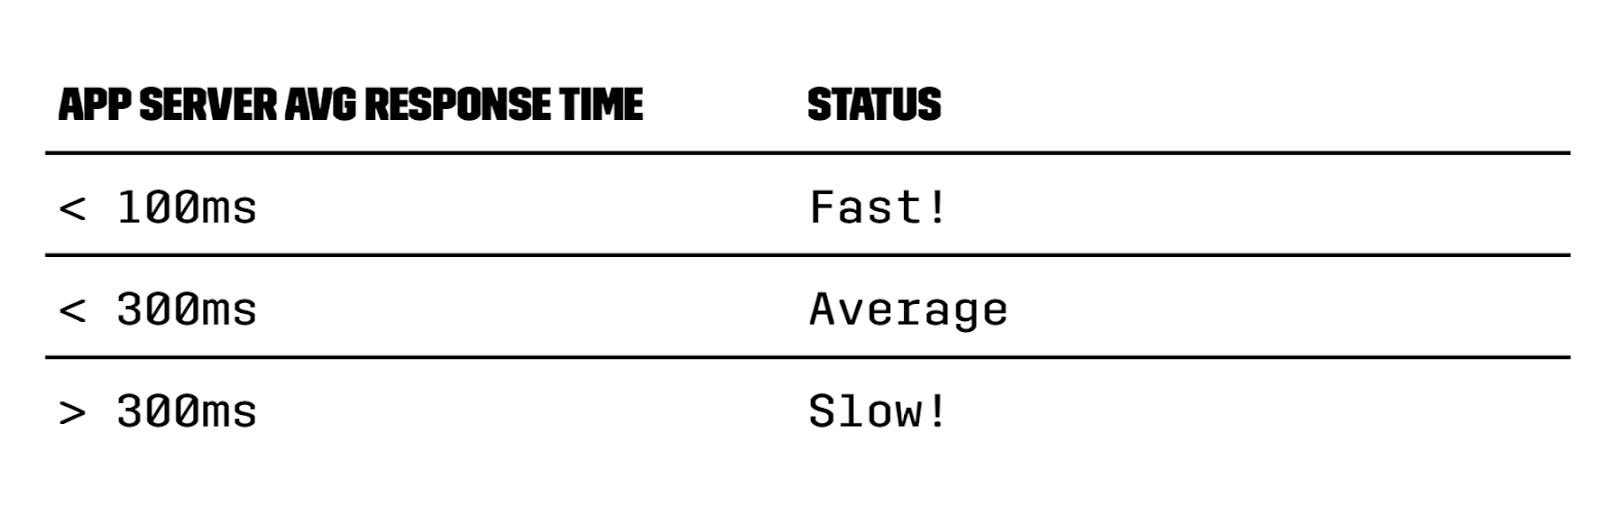
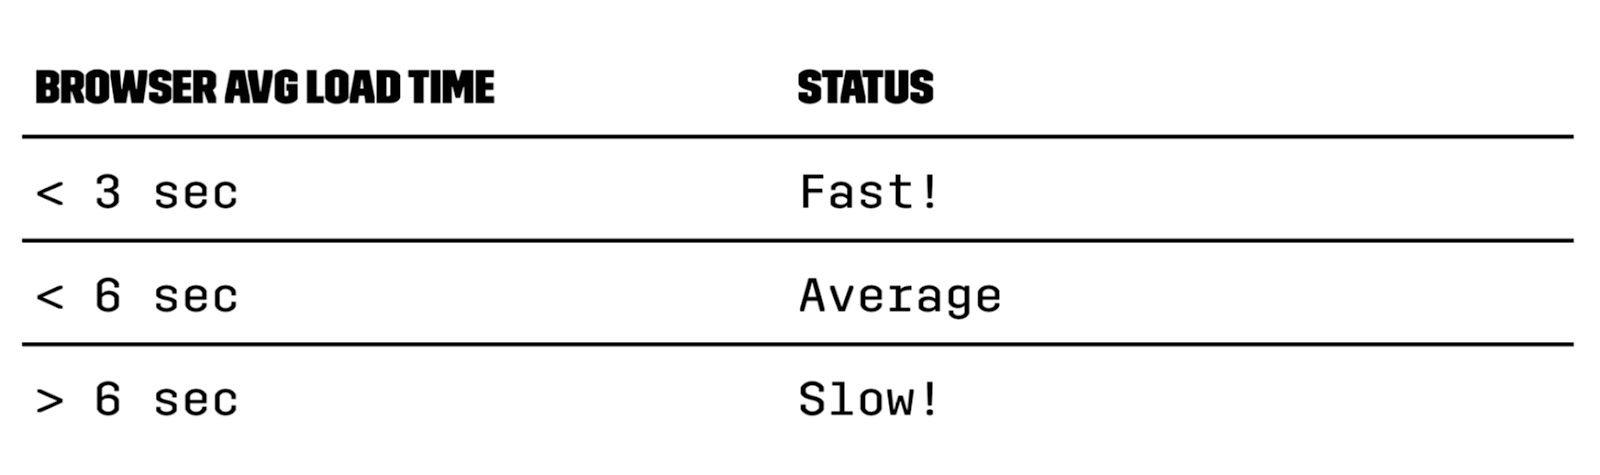
Also, here are are some great charts that will give you a good rule of thumb for determining whether your page is slow, average, or fast!
Average Server Response Time Chart
Browser Average Load Time Chart
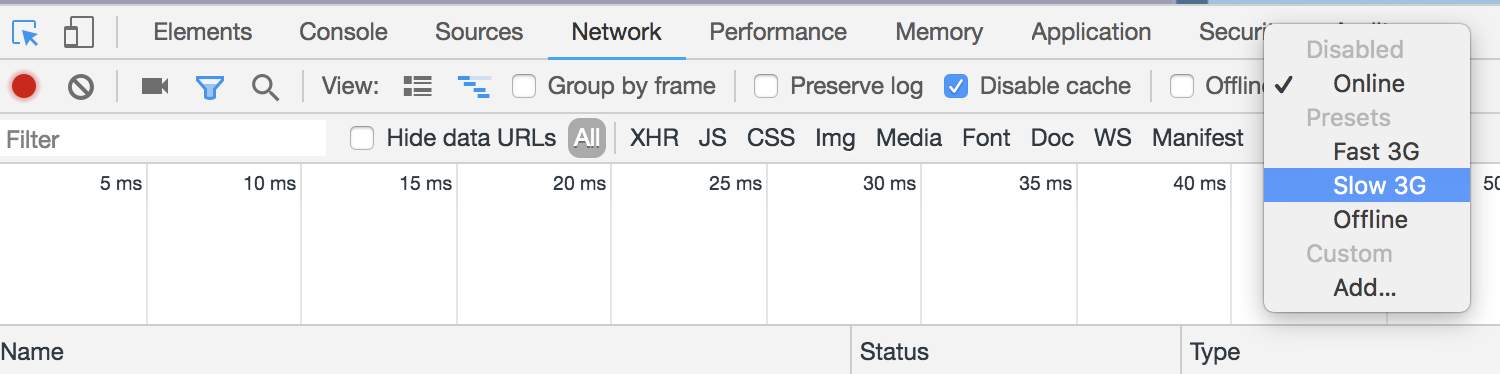
A great tip is to throttle your own Internet connection to something like Slow 3G to see your application when your connection is not super fast (most of us develop using broadband connection). You can do this over here:
This technique combined with Chrome’s performance profiling can show you some problems with the way your page loads. I detected an issue when loading the spreadsheets in Ombu Shop’s homepage.
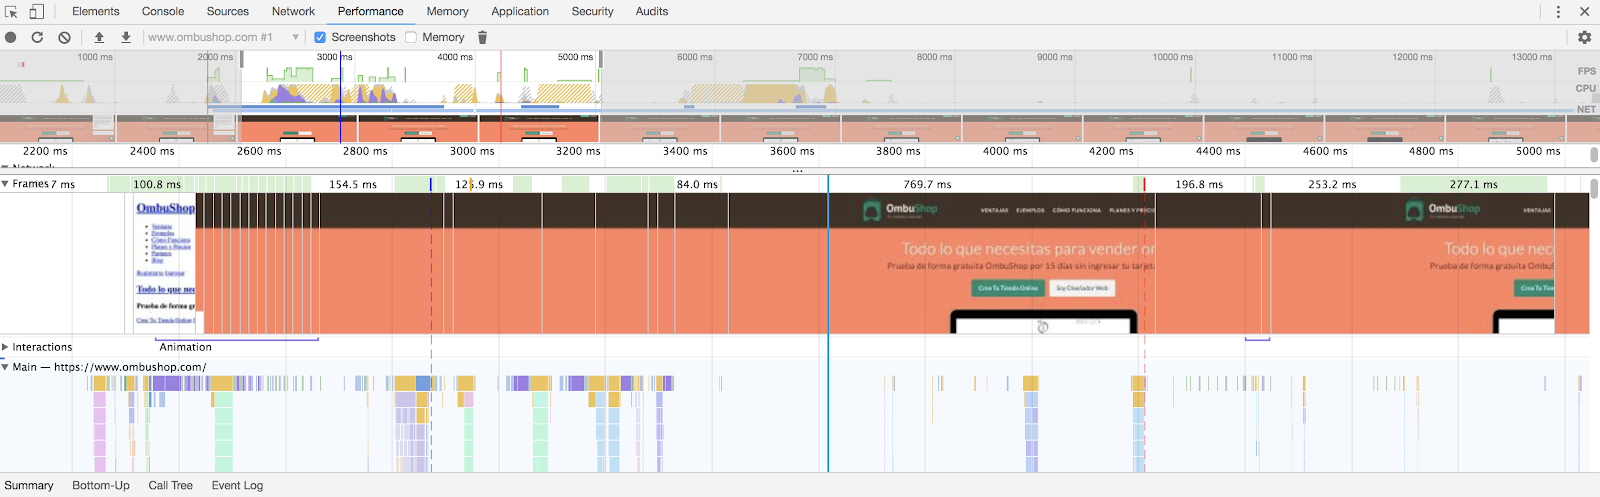
We made the mistake of loading our spreadsheet near the end of the page, not near the beginning (before the JavaScript assets are loaded) so for a split second our page looks like plain text without any style in it.
Final Thoughts
Even for someone who has been working with Ruby/Rails since 2009 and performance optimization projects since 2015, this workshop taught me a lot of useful things. I can’t imagine how much value you would get if you were just starting with Ruby/Rails performance tuning.
There is a lot of value in the content, applying the concepts on a real project, and learning from Nate’s experience. What I valued the most was the constant Q&A (every section had room for questions).
If you have the chance to attend Nate’s workshop, you shouldn’t hesitate. I can’t recommend it highly enough!