With the advent of widely available Large Language Models (LLMs), businesses everywhere have sought to leverage these
models to handle specific tasks that can increase productivity of their teams, automate specific tasks, increase the
abilities of chat bots, among a variety of other things.
However, LLMs are not great at handling domain-specific tasks out of the box. In this article, we’ll explore a few
different techniques to enhance the capabilities of LLMs and help them perform well for your specific use case.
Why Bother?
Large Language Models are available in a variety of different ways. Some are available through APIs (pair or not) like
OpenAI or Mistral models. Others are available
to run locally like Meta’s LlaMa 2 model. Regardless of which model you choose,
these LLMs provide a solid foundation for our AI needs, but more often than not, you need to build upon that foundation.
These models are pre-trained on very large datasets, and are designed to generate responses based on a broad
understanding of language and knowledge. They are not designed to handle highly specific or specialized scenarios, and
might lack that extra depth in responses needed for some use cases, like technical support.
LLMs are also trained on a dataset that is fixed at a certain point in time, and thus don’t have access to up-to-date
information. In a large portion of real world use cases, when language models need to interact with users (internal or
external) to provide information, it is important for them to evolve as the information evolves and new information is
generated.
The reliability of LLMs is also not always optimal. These models hallucinate, and LLM hallucinations can be a big issue,
especially in use cases where an external user who needs reliable information is involved.
Hallucinations are defined as the model producing outputs that are coherent and grammatically correct, but are
factually incorrect or nonsensical. That is, the model is “confidently incorrect”.
These hallucinations can happen due to a variety of reasons, including training data limitation and quality, the
interpretative limits of the model, the inherent complexity of language, biases in the model, among others. Techniques
to help LLMs perform better on smaller, specific scenarios can help reduce that risk and improve their reliability.
Finally, cost and scalability play a role in using LLMs as well. Direct queries to an LLM can become expensive, and
training (and re-training) your own model is even more costly. Techniques to help these models “focus” on a specific
scenario and pre-filter relevant information can help reduce the computational load on the LLM and the associated cost.
These are all good reasons to implement techniques to enhance the capabilities of LLMs, and help them perform better in
specific scenarios. So let’s take a look at a few of these techniques.
Prompt Engineering Techniques
The simplest of the techniques we’ll cover, prompt engineering focuses on perfecting the input to elicit the best possible
outputs from the model. Unlike the other methods in this article, Prompt Engineering does not involve modifying the model
or integrating anything new into it.
Large language models are tuned to follow instructions, and are able to generalize from a few examples based on the diverse
patterns they have encountered during their training, since they are trained on very, very large datasets. Prompt engineering
leverages these capabilities to improve the responses obtained directly from the LLM.
Zero-shot prompting
Zero-shot prompting is the simplest, most common form of prompting. It involves prepending a specific instruction to the
query without providing the model with any direct examples or additional information.
Let’s take, for example, a restaurant looking to classify reviews as positive, neutral or negative. A zero-shot prompt
would look like this:
Classify the following restaurant review as positive, negative, or neutral:
"The menu was extensive, but the flavors were just okay. Nothing stood out as a must-try."
And the language model would output a classification.
Few-shot prompting
Few-shot prompting involves giving the language model a few examples to work with, helping guide it towards the desired
response. It’s useful when you want a specific response format, or when the output you’d like is hard to describe.
For the same scenario as above, if you’d like to, instead of getting a general sentiment for the review, break it down
into specific aspects, you could construct a prompt like this:
Classify the sentiment of the following restaurant review focusing on food, service, and ambiance:
Review: "The steak was cooked to perfection, but the service was a bit slow. The rooftop view was breathtaking, though."
Food: Positive
Service: Negative
Ambiance: Positive

Classify the sentiment of the following restaurant review focusing on food, service, and ambiance:
Review: "The dishes were uninspired and bland. However, the staff was friendly, and the interior decor was charming."
Food: Negative
Service: Positive
Ambiance: Positive

Now, classify the sentiment of this restaurant review focusing on food, service, and ambiance:
Review: "Amazing cocktails and appetizers, but the main courses were disappointing. The place was noisy, making it hard to enjoy the meal."
The model can then output a response following the desired format, since it has a frame of reference.
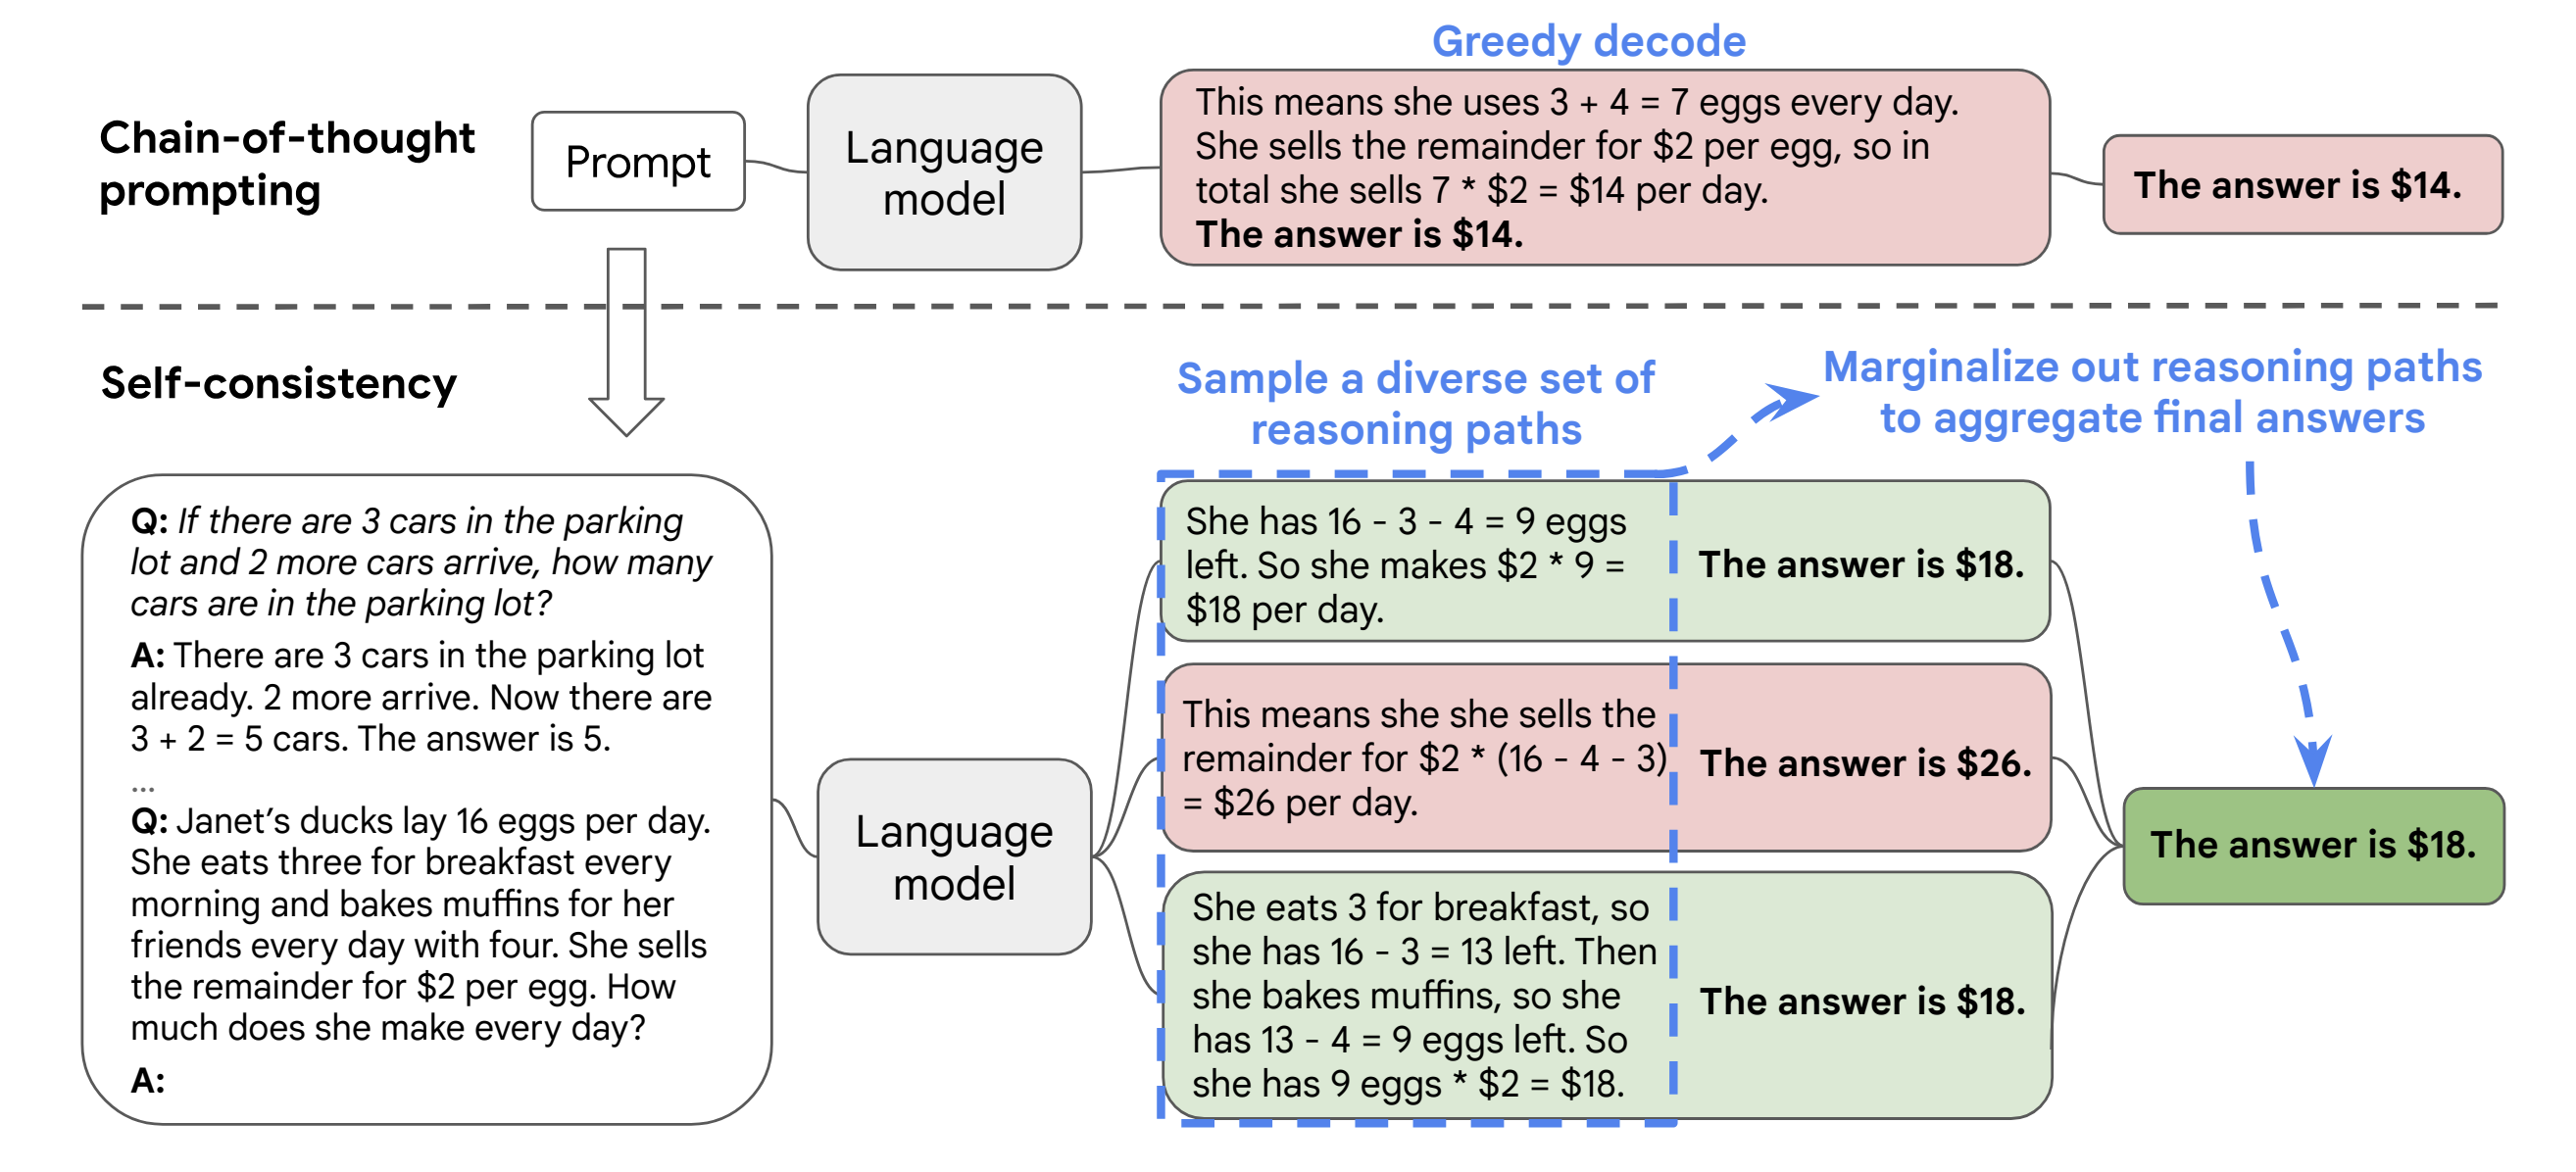
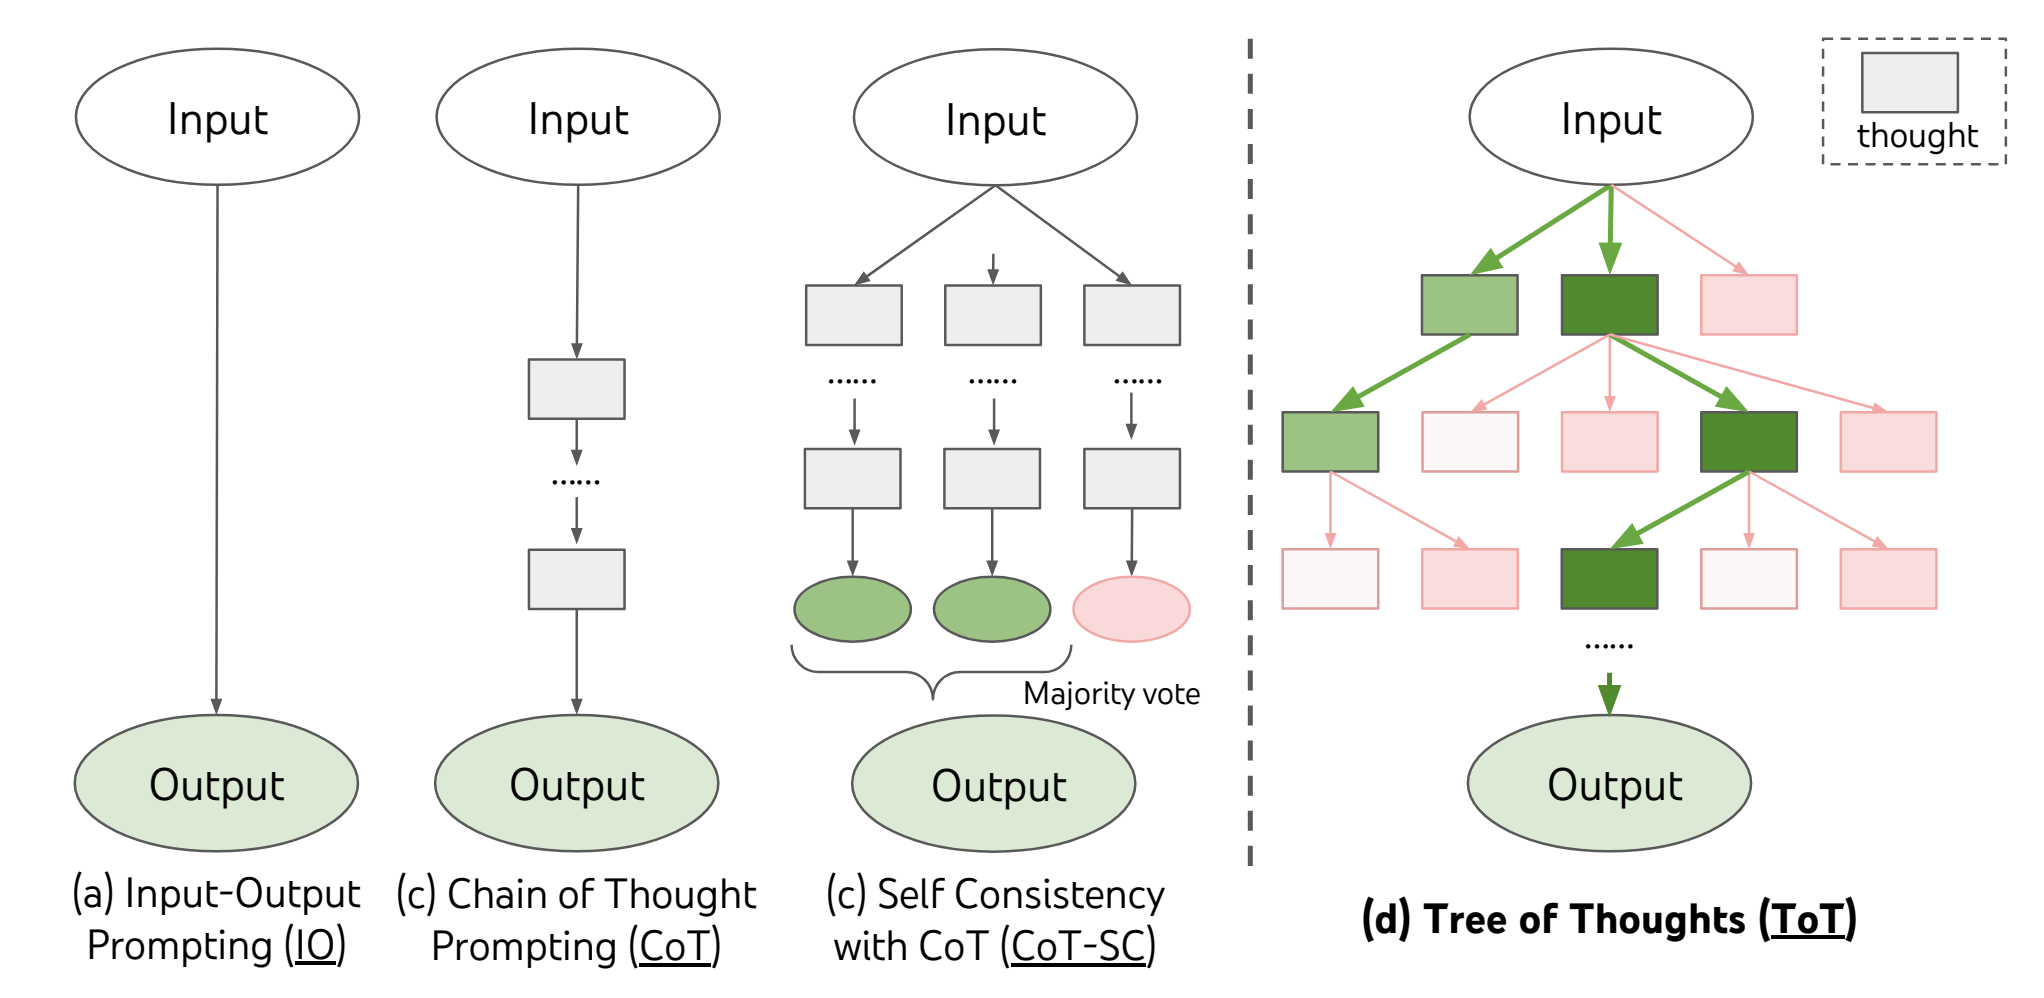
Chain-of-thought prompting
The idea behind chain-of-thought prompting is to guide the model through intermediate steps to allow for more complex
problem-solving, by “guiding” the model through the reasoning steps.
A good example of how chain-of-thought prompting can enhance the model’s response is presented by Wei et al. (2022)
in their paper introducing the method. Let’s take this standard prompt:
Question: Roger has 5 tennis balls. He buys 2 more cans of tennis balls. Each can has 3 tennis balls. How many tennis
balls does he have now?

Answer: The answer is 11.

Question: The cafeteria had 23 apples. If they used 20 to make lunch and bought 6 more, how many apples do they have?
The model output for the prompt in their experiment was:
Answer: The answer is 27.
It’s quite easy to see that the answer is incorrect. It should be 9, not 27 as outputted.
Let’s apply chain-of-thought prompting instead:
Question: Roger has 5 tennis balls. He buys 2 more cans of tennis balls. Each can has 3 tennis balls. How many tennis
balls does he have now?

Answer: Roger started with 5 balls. 2 cans of 3 tennis balls each is 6 tennis balls. 5 + 6 = 11. The answer is 11.

Question: The cafeteria had 23 apples. If they used 20 to make lunch and bought 6 more, how many apples do they have?
The model output now was:
Answer: The cafeteria had 23 apples originally. They used 20 to make lunch. So they had 23 - 20 = 3. They bought 6 more
apples, so they have 3 + 6 = 9. The answer is 9.
Now, the model outputted the correct response.
It’s also possible to combine zero-shot and few-shot prompting with chain-of-thought prompts, for even more powerful
prompting.
Other Techniques
In addition to the three techniques mentioned above, there are a variety of other prompting techniques that can be used
to enhance results, such as contrastive prompting (providing examples of both correct and incorrect responses
to help the model identify desired and undesirable outputs), role-based prompting (assigning a role or persona to the
model to influence tone, style and other general characteristics of the response), analogical prompting (using similar
problems or scenarios to guide the model’s response), among many others.
Ultimately, the most important thing to keep in mind is prompting is an iterative exercise. Refining your prompts to get
the desired results and trying multiple techniques to see which ones perform better is the best way to find what works
for your specific use case.
For a large portion of use cases, prompt engineering techniques are “good enough” to get the model to perform at the
desired level. For those where it isn’t, we have the techniques below in the toolbox.
Transfer Learning
Transfer learning is a strategy that employs a model developed for one task as the starting point for a model on a
second task. It enables models to leverage pre-existing knowledge to solve new but related problems, improving the
learning efficiency.
In the context of language models, this means we can take a model trained on a large corpus of text (an LLM) and use
these learned word and context representations to solve new language tasks, such as sentiment analysis or text
classification.
There are several approaches that can be applied to transfer learning, such as fine-tuning, multi-task
learning, and feature extraction, to name a few.
Full fine-tuning
Full fine-tuning (also known as instruction fine-tuning) aims to enhance a model’s performance across a variety of
different tasks by training the already pre-training LLM on a smaller, specific, labeled dataset of examples and
instructions that guide its responses to queries.
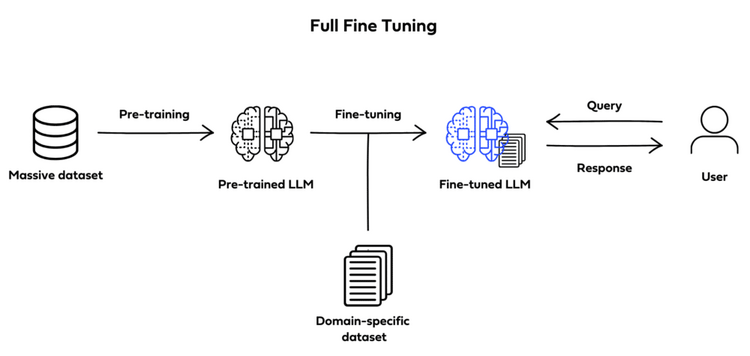 Image by Deci.ai
It involves training the entire model on this new dataset, thus adjusting all layers of the language model during the
training process, meaning all model parameters are updated. The model will learn from the specific examples in your
instructions dataset, which should include examples of prompts and completion to guide the model.
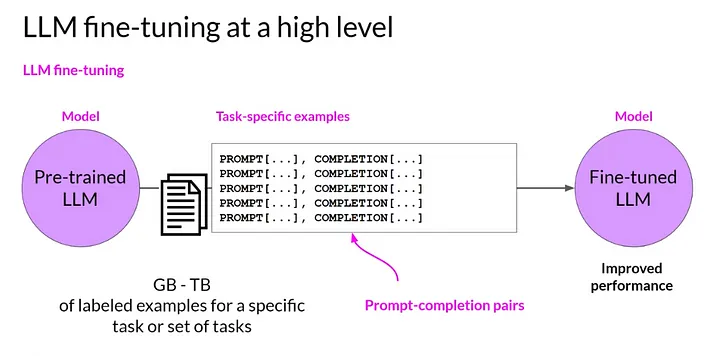 Source: Coursera: Learn Generative AI with LLMs
Fully fine-tuning a model involves creating a dataset specific to what you’d like to fine-tune the model on, pre-processing
the data to transform it into something the model can consume, training the model (fine-tuning it) on your new dataset
and evaluating its performance. Iterate over that process as many times as needed, making the necessary adjustments, to
achieve the desired performance.
Multi-Task Learning
Multi-task learning is also a form of tuning. Its key goal is to train a model to perform multiple, related tasks
simultaneously. The logic behind it is that learning one task should enhance learning of the other, related tasks.
For example, we could train a model to perform sentiment analysis on reviews for a restaurant while also training it to
classify the reviews according to their main focus (food, service, location, etc.).
Multi-task learning is accomplished in a very similar way to fine-tuning; however, the dataset would now include
instructions for all tasks you’d like to train the model on.
It is important to keep in mind some of the things that can go wrong, though! For proper multi-task learning, we need to
ensure tasks are balanced during training, we don’t want the model to become a specialist on one task at the expense of
all the others. Tasks being related also matters. The idea is that learning one task will enhance learning of the other.
Training a model to classify restaurant reviews and predict the weather tomorrow will likely not yield very good results.
Parameter-efficient fine-tuning (PEFT)
PEFT is a form of instruction fine-tuning that focuses on only a subset of the LLMs parameters. Unlike full fine-tuning,
which will create full copies of the LLM adjusting all of its parameters, PEFT updates only a specific subset of parameters
and “freezes” the rest.
By doing this, PEFT allows for more manageable memory requirements while also helping prevent catastrophic forgetting.
Catastrophic forgetting happens when an LLM is fine-tuned to perform one specific task and forgets previously learned
information, performing only on new data specifically.
PEFT avoids the loss of previously learned information by preserving the original LLM weights.
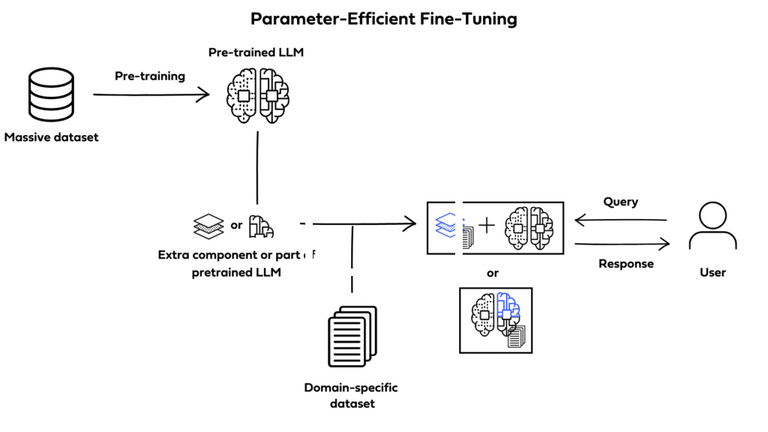 Image by Deci.ai
There are multiple different techniques to achieve PEFT. Some prioritize training select portions of the original model,
altering specific subsets of its parameters; others integrate and train smaller additional components, such as adapter
layers, without ever modifying the LLMs original structure.
Two of the most widely used and effective PEFT methods are LoRA (Low-Rank Adaptation) and QLoRa (Quantized Low-Rank
Adaptation). We’ll cover these methods in more detail in our next article in this series.
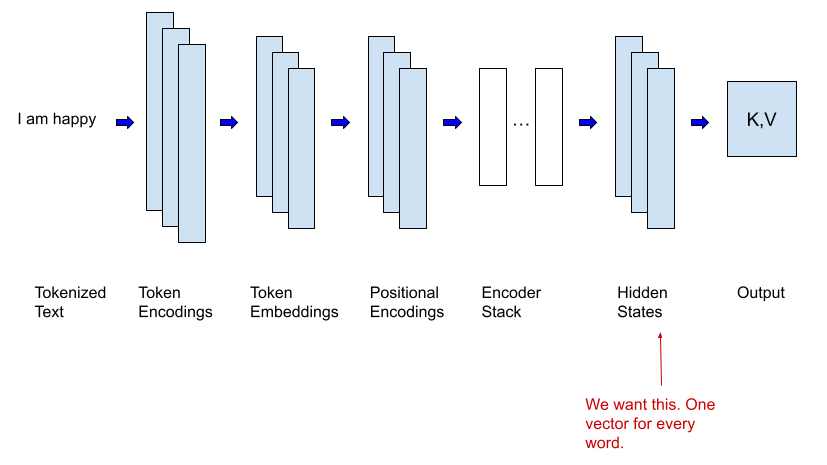
Feature extraction involves using a pre-trained model to extract meaningful features from data, then using those features
as input for a new model or task.
In order to do this, we need to remove the output layer of the LLM (which is specific to the task it was trained on, and
yields a prediction) to access the last hidden layer of the model, which will output a feature vector rather than a
prediction. The feature vector is what we’re interested in.
The extracted features will then be used as input for a new model that is trained to perform a different task. Now, only
this new model needs to be trained from scratch.
This new model is usually much smaller and less complex, and thus more computationally efficient. This is possible because
the heavy lifting of extracting meaningful features from data has already been done by the pre-trained model.
Retrieval Augmented Generation (RAG)
Retrieval Augmented Generation is a completely different way to augment LLMs. Unlike Transfer Learning techniques, it
doesn’t alter the original model at all, but rather integrates it with a retrieval mechanism that can help the language
model “look up” information.
RAG doesn’t have to be an alternative to fine-tuning though. A combination of the two can be incredibly powerful in
creating specialized LLMs with access to up-to-date, specific, niche information.
 Source: Gradient Flow
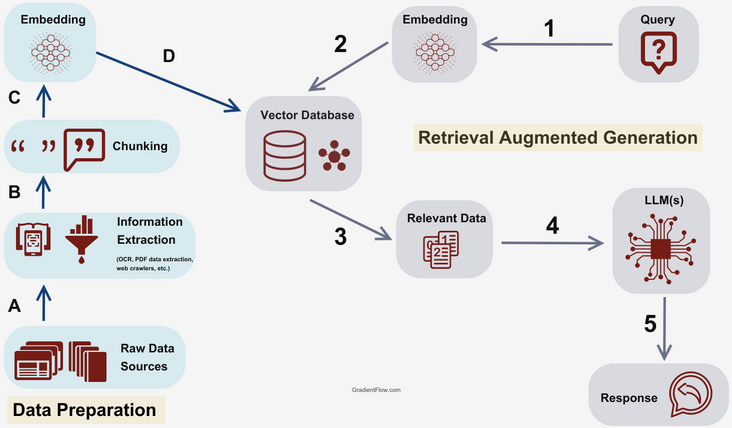
The core idea behind RAG is to use a retrieval mechanism to fetch additional, relevant information before sending a
query to the LLM, so that this additional information can be leveraged by the LLM to produce a better response.
For language models, since we’re dealing with textual information, the most common scenario is to have a vector database
that stores the domain-specific dataset as embedded vectors. However, it is also possible to incorporate all kinds of
data storages into the retrieval mechanism, depending on your specific use case.
The standard flow of a simple RAG implementation could look like this:
- User submits a query
- Query is embedded
- Semantic search is used to retrieve relevant information from the vector storage based on similarity
- This relevant data is combined with the original query into a carefully crafted prompt
- The prompt is sent to the LLM to produce a response
- The response is sent to the user
There are multiple ways to enhance this flow, and multiple advanced RAG techniques that will be covered in future
articles in this series. For now, at a high level, RAG is a great way to integrate a retrieval mechanism to leverage
new, specific and up-to-date information to enhance an LLMs capabilities, yielding better responses in specific use cases.
Which one is the best?
The one that fits your use case.
Which technique is best depends on the specific characteristics of your use case, restrictions around cost, computational
power, and time, among other factors.
In simpler use cases, where the model doesn’t need to access very specific or up-to-date information, prompt engineering
is often enough. Getting the desired output is more about leveraging the model’s capacity to generalize, draw parallels,
and follow examples to get the desired outputs in the desired way. However, it is not robust or reliable enough for
use cases where additional background knowledge is required, or knowledge specific to a domain is required.
For use cases where knowledge of a specific domain and its nuances is required, or where the foundational model simply doesn’t
perform your specific task well, fine-tuning is a good option. It is especially beneficial in areas with specialized
jargon, concepts or structures, for example in handling legal documents, medical research or financial reports. Fine-tuning
enhances the accuracy and robustness of the model by exposing it to more examples, edge cases, and less common scenarios
in the domain-specific dataset, while leveraging the general language constructs it has already learned in original training.
The counter points of fine-tuning are the high computational costs, since it involves updating the parameters of a large
language model, which can be quite expensive. It also has large memory requirements and demands a high time investment and
a high level of expertise.
Finally, if the model needs access to a broad range of information, and especially if it needs to use up-to-date information
and documents that weren’t part of the training set (without retraining it, of course), RAG is the best option. For example,
for a technical support chat bot that needs access to the company’s knowledge base and policies, it’s important that the
model gains access to up-to-date information, and retraining it every time an update is made is very cost ineffective.
RAG also has limitations, however. The idea behind it is that it enhances the LLMs information retrieval capabilities by
drawing context from the provided external data; but additional context is not always enough. If the pre-trained LLM is
not great at the specific task (for example, summarizing financial data), just providing additional context in the form
or extra information won’t help much. RAG also requires an “upfront investment” in making sure the external dataset used
is prepared to be used in such scenarios, so that the most relevant information can be retrieved reliably and is not used
in a way that confuses the model rather than enhancing it.
Finally, it’s also important to be careful when using AI, especially to interface with external customers, and to be aware
of its limitations. All language models can hallucinate, and none of the techniques mentioned get rid of that risk completely.
Therefore, always evaluate the potential risks of integrating AI into your use case and how to mitigate them. A good
example of these risks materializing is a chat bot gone rogue earlier this year, making up a refund policy that didn’t
exist. Check out the Air Canada Has to Honor a Refund Policy Its Chatbot Made Up
article by Wired.
Conclusion
LLMs are incredibly powerful and can be used to enhance a wide variety of existing use cases, as well as enable new ones.
Integrating LLMs into a product, internal flow or website can be a really good way to automate repetitive tasks, increase
productivity, enhance user experience and take the capabilities of your product to the next level, unlocking new value
for users (and for your company).
These techniques provide ways to enhance the LLMs capability and tailor them to your specific use case, ensuring they
perform at the desired level in whichever task you desire to accomplish. Looking to leverage generative AI to solve
specific problems? Need help figuring out how AI can help your company? Let’s talk!.
This blog post is part of a series with our friends over at Shift Interactive. Stay tuned for more!
]]>