Software Development
Request queue and why you should care about it

Introduction
Have you ever wondered what the values on the request queue graph in the APM tool meant or whether a certain value indicated good or poor performance?
The fundamentals of request queue, factors that contribute to longer request queues, and other topics will be covered in this post.
What is a request queue time?
It is the entire amount of time between when the user made the request and when your application server began to process it. The server is unable to accept every request and process them simultaneously. Everything has a threshold. In other terms, it is the amount of time that a request must wait before being addressed.
Why do you need to measure request queue time?
Imagine that you have two AWS instances operating, and the traffic is being routed by an ELB. If you don’t make their experience better, your users will choose another vendor after complaining that your application is too slow. The first step is integrating an APM tool, like New Relic. The p99 response time is 220ms, as you can see. You tell yourself that 220 milliseconds is not at all slow.
Why does the user think it’s too slow?
Time in the request queue is useful in this situation. Consider the request queue time is 2 seconds. This indicates that your users’s request will be processed after 2 seconds. The user’s experience is that they had to wait 2 seconds plus 220 ms, or 2.2 seconds, before they got a response from your application, which is not a great user experience even though the processing time or response time of the application is 220 ms.
Where do you see the request queue time in the APM?
New Relic, by default, shows the request queue time on the dashboard. Here is what it looks like:
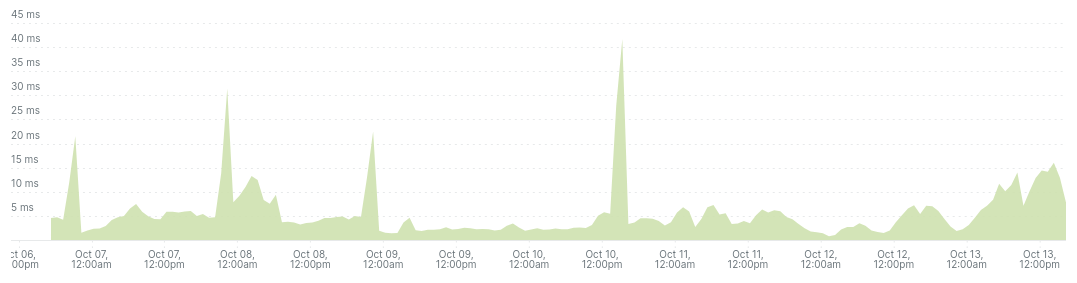
On Datadog, this is not captured by default. You have to configure the agent to start collecting this metric as well. Read more in their guide to enable collection of request queue time.
Typically, request queue time should not exceed 15ms.
What are the factors that can lead to higher request queue time?
Here are a few of the most typical ones (but there are many others):
- Under provisioned infrastructure
- Less workers / threads of the app server
- Not so well performing code
- Garbage collection happening too often
How can you reduce the request queue time?
It depends on the cause of the high request queue times.
- If the application’s response time exceeds what is considered acceptable, you should focus on speeding up the sluggish endpoints and then see if this reduces the time spent in the request queue.
- You should examine how the infrastructure is provisioned.
- You can adjust the OOBGC (Out of band garbage collector) setting for applications that use Ruby specifically. Basically, it is a mechanism to alter the frequency of garbage collection in Ruby. Tracking the duration of the request queue and the amount of system memory used will enable you to adjust the frequency of GC. For illustration, set it to 20 and watch how the memory consumption and request queue time change. Here is a blog post by Aaron Patterson explaining how OOBGC affected Github’s performance.
Gotchas with AWS ELB
You may be startled to learn that AWS does not enable measuring the request queue time and that you are essentially on your own if you are using AWS ELB to route traffic to your application. Additionally, you can read it here .
Fortunately, there is still a means to track that. You can still monitor the request queue time if Nginx or another web server is also configured in your system.
If you are using Nginx, you can add the header x-request-start :
proxy_set_header x-request-start "t=${msec}";
The APM would then look for this header and its value to calculate the queuing time.
Conclusion
I hope you enjoyed reading this and got some insights about request queuing. You can read more about request queuing here .