Software Development
Measuring the Impact of Software Maintenance

Introduction
“If you can’t measure it, it doesn’t exist” - Peter Drucker
Tackling technical debt can be a thankless task. You can spend hours tidying up old files but at the end there’s little to prove it was a good use of time. No target was met and no new feature exists to show the bosses.
The lack of metrics means that maintenance tasks gets pushed back behind work with obvious outcomes and the debt keeps building.
To make matters worse, the costs of technical debt are also hidden . Projects will start to overrun and developers will get burnt out, but there’s nothing clearly showing that tech debt is the reason why. It means maintenance starts to feel like a chore with no obvious outcome or benefit.
We have had to come up with ways to show the value of our work when performing maintenance for clients, so we wanted to share them here to serve as inspiration for other developers.
Closing security vulnerabilities
Security weaknesses are the most obvious issue with tech debt, so it’s a good place to start when performing and measuring maintenance.
Using outdated and unsupported code can create security vulnerabilities in your software. Using an ancient version of Ruby on Rails or old gems can leave you open to potential headaches.
The simplest approach is to generate a list of vulnerabilities in the codebase that you can then tick off once they are fixed.
There are various tools that can scan your stack, such as Bundler-audit which will create a list of weak gems.
That list means you have obvious tasks, which can be set as goals for a sprint or ticked off as work achieved.
Creating a metric for problem files
What about the code that’s only causing headaches for your developers, not security risks for users? You probably have a bit of a gut feel for which files to look at, but we wanted a more numerical approach.
Technical debt can be thought of in many ways so there’s no one right way to approach it. For our assessment, we decided to score files based on how likely they are to be causing issues when new features are built.
As a first step we went with a score based on Churn * Complexity.
The churn is measured by the amount of times a file has been committed in Git. For complexity we use Flog, which assigns a score to every operation or statement.
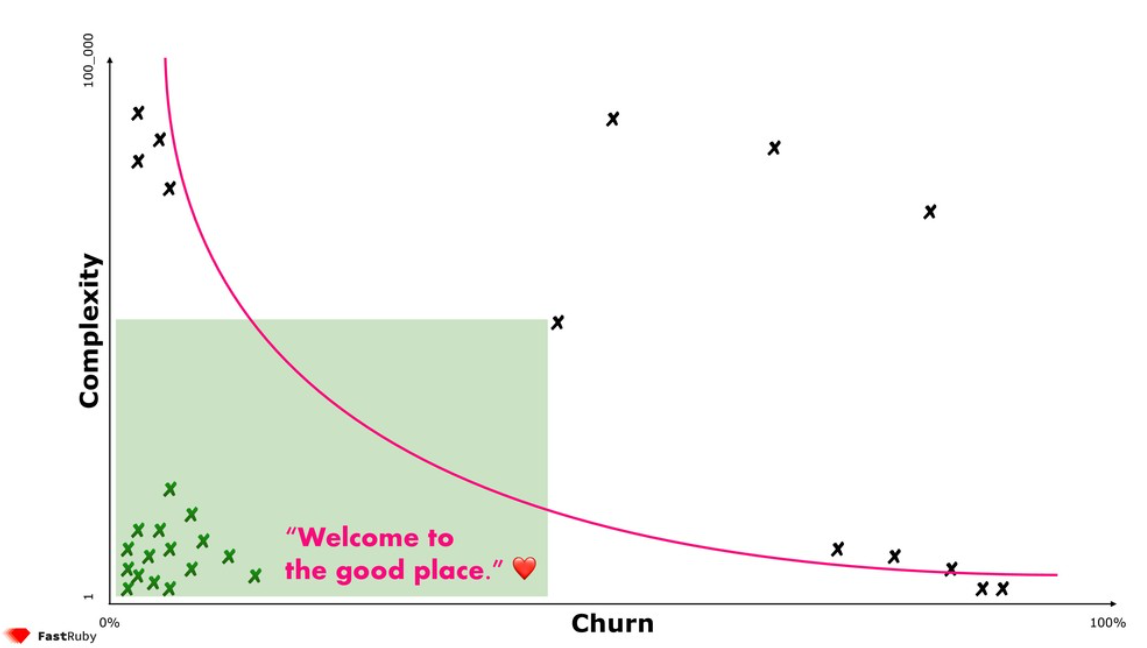
Files in the lower left are unlikely to be causing issues. They are simple files that rarely change, so low scoring files can be left alone.
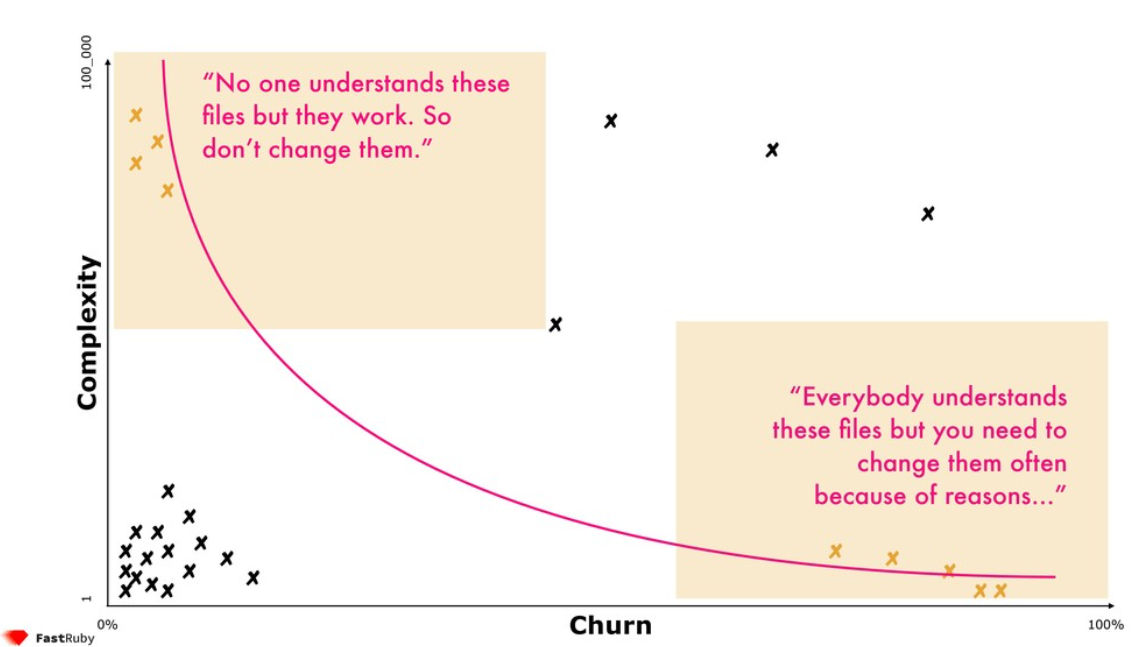
Then we have two groups that are maybe cause some headaches, but don’t pose a huge risk. There are complex files that rarely change or simple files that frequently change.
“If the code never changes it’s not costing us money” - Sandi Metz
That leaves us with the problematic files in the top right, the complex files with lots of commits. We now have a numerical value we can point to that shows which files are candidates for maintenance.
Accounting for coverage
Once we were able to identify problem files, we wanted to know which to work on first.
Refactoring modules with poor test coverage can quickly blow up in our faces. You don’t want bad changes to hit production and you probably don’t want to run manual tests.
So, we add code coverage as a third variable.
This creates our Stink score, identifying complex files with high churn that have little coverage.
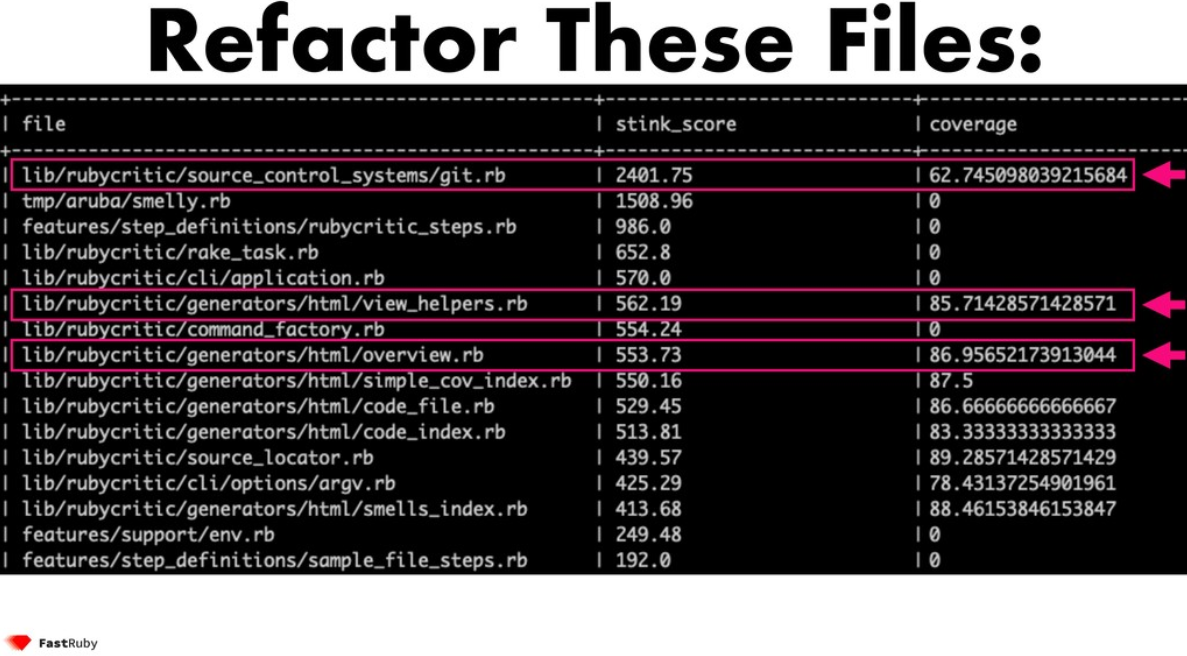
The analysis gives us a to-do list of files that require more test coverage or that need refactoring.
Reducing the stink
Any maintenance work will now reduce the average stink score across your codebase.
It gives a metric to track over time. It can drop or rise with each project, providing a gauge for the engineering practices and amount of effort dedicated to software maintenance.
We will often go into a project with an aim to reduce the stink score by a defined percentage. It gives clients a more specific outcome than just saying the hours spent.
Use Skunk to measure stink in Ruby projects
It is possible to run these tests with open source tools. For applications on Ruby we have created Skunk , which creates a stink score based on the churn, complexity and code coverage.
Conclusion
Measuring technical debt is not a straightforward challenge. There’s no definite right way to measure code quality and troublesome files might be overlooked.
But, we find that the stink score serves as a good indicator for assessing maintenance work.
If you run Skunk on your project we would love to hear back from you. And of course, if you would like help clearing your technical debt then contact us today .